
Google Introduces 4 New PPC Ad Placement Metrics
Google provides a large amount of data to businesses that use their tools for search advertising. However, the way they’ve given out data in the past hasn’t always been too clear. This has led to confusion about where ads are
Google provides a large amount of data to businesses that use their tools for search advertising. However, the way they’ve given out data in the past hasn’t always been too clear. This has led to confusion about where ads are being placed or how well a particular ad is performing in search results. To remedy this situation, Google is introducing new ad position metrics to help advertisers understand their ad performance.
The old ad metrics Google used were a little unclear (possibly intentionally) and it probably resulted in people thinking their ads were performing better and appear in better positions than the actually were. To illustrate, an ad with an average position of “1” could be appearing only at the bottom of the page. The new metrics will make it easier to see how an ad is performing and where it’s showing up.
As Julien Jaquet explained in a Google blog post, “Contrary to common perception, average position is not meant to describe where the ad appears on the page. Average position reflects the order that your ad appears versus the other ads in the ad auction. As a result, an ad position of “1” means that your ad shows ahead of all other ads, but it doesn’t mean the ad was at the very top of the page. Sometimes no ads are displayed above the organic search results so the ad with a position of “1” appears at the bottom of the page.”
To replace average position, Google is introducing four new metrics that should provide a better and easier-to-understand overview of ad performance. The new metrics are:
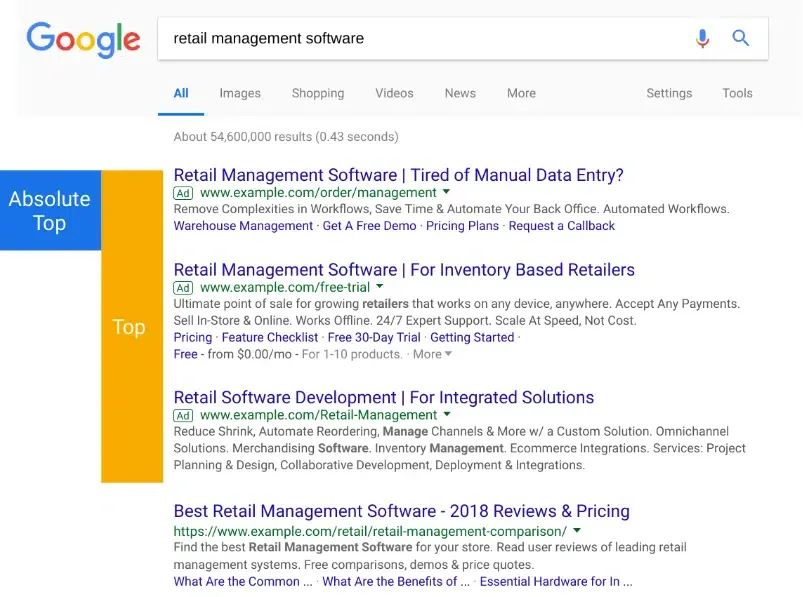
- Impr. (Absolute Top) % – This is the percentage of your ad impressions that are shown as the very first ad above the organic search results.
- Impr. (Top) % – This is the percentage of your ad impressions that are shown anywhere above the organic search results.
- Search (Absolute Top) IS – This counts the number of impressions you’ve received in the absolute top location (the very first ad above the organic search results) divided by the estimated number of impressions you were eligible to receive in the top location.
- Search (Top) IS – This counts the number of impressions you’ve received in the top location (anywhere above the organic search results) compared to the estimated number of impressions you were eligible to receive in the top location.
Marketers can use the first two metrics, “Impression (Absolute Top) %” and “Impression (Top) %“, to determine when and where your impressions are showing above the organic search results.
The other two metrics, “Search absolute top impression share” and “Search (Top) IS” can be used to indicate the available opportunity to show your ads in more prominent positions. Marketers who are trying to bid for page location should use these metrics. In the future, Google plans to incorporate these metrics into automated bidding options in Google Ads.
As Google summarized in their announcement, “If you are using average position to understand the location of your ads on the page, it’s better to use Impression (Absolute Top) % and Impression (Top) %. If you are using average position to bid to a page location, it’s better to use Search (Abs Top) IS and Search (Top) IS.”
So be ready to see some new metrics when you run reports on your Google PPC ads. Remember that your ads are performing the way they always have, the new reports are just better reflecting where they were and how well they did.
Check out this article for more practical marketing advice small business owners can use.
Quick check
Is your site AI-ready?
Does each service have its own page with the answer up top?
Is your main answer in the first 60 words of the page?
Do your headings match how customers actually search?
Does your site load fast and stay clean on mobile?
Do your pages have schema (FAQ / Article) marking them up?
More on Google Ads & PPC


Built and managed thousands of WordPress, Wix, and Shopify sites, plus hundreds on Squarespace, GoDaddy, BigCommerce, Duda, and Weebly.
